Estimation of Infections Based on Wastewater Data (USA / Germany)
USA
Methodology:
Estimation based on Biobot data (until April 2024)
Scripts and data can be found on Github.
Our methodology integrates wastewater surveillance data with epidemiological models to present a view of COVID-19’s prevalence across the United States, down to individual states. We sourced our wastewater data from Biobot Analytics [1], which reports the “effective concentration” of SARS-CoV-2 in sewage. Recognizing the variability in testing rates and accuracy, we devised an approach that has already been used in a similar way by Michael Hoerger (2020) [2] to estimate daily infections. We selected the initial five months of 2021—when testing was believed to be robust—and divided Biobot’s wastewater concentrations by IHME’s infection estimates to derive a base conversion factor.
This period exhibited a strong correlation (0.99) between the two data sources (IHME and Biobot), instilling confidence in our method. However, acknowledging the impact of SARS-CoV-2 mutations, particularly those associated with the Omicron variant, we adjusted our conversion factors from 2022 onwards for a second estimate of infections. These adjustments—x1.53 for the onset of Omicron on 12/17/2021 and x2.28 for subsequent mutations on 08/01/2022—account for potential underestimations in viral concentration due to genetic changes in the N1 area affecting detection [3]. To smooth these transitions and avoid abrupt shifts in our estimates, we implemented a 30-day smoothing period for each adjustment phase.
Displayed is the range of estimated infections from wastewater data, with the “Min” curve representing a scenario based on N2 copies (which are unaffected by mutations in the N1 probe area) and the “Max” curve showing a fully adjusted estimate using N1 copies (which are more susceptible to these mutations). We also introduced an option to visualize wastewater data alongside infection estimates, allowing users to compare trends with or without adjustments. Users can toggle the display of the wastewater data to explore the unadjusted concentrations.
Our visualizations, therefore, offer a dual perspective: the weighted average state and national wastewater concentrations derived from treatment plant data and our adjusted estimates of new daily infections, each represented on separate y-axes for comparison.
Estimation based on NWSS data (from April 2024)
After the end of regional data availability from Biobot, we switched to source data from CDC’s National Wastewater Surveillance System [4]. We only considered data normalized by flow (in gene copies / capita / day) for our infection estimates.
Similar to the previous approach, we derived a conversion factor from wastewater data to infections by dividing aggregated, weighted and smoothed NWSS wastewater data by the infection estimates we had obtained previously from Biobot data, and averaged over the selected period. We selected data from the most recent four months for this period, as the number of treatment plants contributing to the NWSS dataset has increased over time.
To provide a seamless historical perspective, Biobot’s earlier data (in copies per ml) was converted into the NWSS metric (copies per person) using region-specific conversion factors, allowing for a unified visualization across the entire time period.
Limitations:
Estimation based on Biobot data (until April 2024)
Our analysis relied on IHME infection data and Biobot wastewater data. However, wastewater data was available in the first 5 months of 2021 in the following subset of 10 states: MA, FL, IN, CA, KY, PA, MT, CT, VA, NV. Additionally, correlations higher than 0.75 happened in the following subset of 8 states: MA, FL, IN, CA, KY, PA, MT, VA. Therefore, interpretation of infection estimates for a number of states should be made with care because of the following reasons:
(1) The following 42 states did not have (continuous) wastewater data in the first 5 months of 2021, the period used to calculate conversion factors. Instead, national wastewater concentrations were used as an approximation [1].
CO, NJ, OR, DE, IL, WY, AZ, MN, NY, OK, HI, ID, TN, ME, WA, RI, VT, VI, AR, MO, TX, IA, NM, AL, WV, KS, MD, NH, NC, WI, LA, SC, MI, UT, GA, MS, NE, OH, DC, SD, ND, AK
An alternative could have been to calculate an estimate of wastewater data based on geographically close states. However such an approach would introduce assumptions that might bias our dataset towards the distribution of the geographically close states. Despite using national wastewater concentrations for our estimations, we acknowledge that this approach may not capture individual state specificities. However, we consider it allows for meaningful overall trends to be visible in our estimations.
(2) The following 16 states’ IHME infection data and Biobot data showed a correlation of less than 0.75 for the time period used to calculate the conversion factor.
NJ, CT, IL, NV, GA, VT, AK, ME; less than 0.5: ND, WA, OR, CO; less than 0.25: HI, MN, MI, VI
Out of these 16 states, 14 states used the national wastewater average as described in (1). The low correlation likely implies a difference between the national average and the missing local data, because of the previously mentioned strong correlation in the rest of the dataset. However, for CT, NV there was wastewater data available but the correlation was below 0.75. We consider the inclusion of this data still valuable, since it could represent diverse dynamics outside of the scope of our linear model. A low correlation does not necessarily imply a lack of relationship between variables, but rather it could imply a non-linear relationship. Therefore, we still include the data in our estimations since we believe it better represents the real-world complex system.
Estimation based on NWSS data (from April 2024)
Due to the time required for data collection and submission from all treatment plants, the most recent two weeks of visualizations should be interpreted with caution. For instance, the infection estimates for two weeks ago might be based on data from over 1,000 treatment plants, covering approximately one-third of the U.S. population. In contrast, the estimates for the most recent day may rely on mostly repeated data from treatment plants whose last reports were within the last two weeks, and any changes in estimates might be due to the newest data from only a few treatment plants, representing less than 1% of the population.
The visualization includes nationwide data and state-level data for states that met the following criteria during the period used to calculate the conversion factor: a minimum of 3 contributing plants, at least 25% of the population covered, and a correlation of at least 0.5 between NWSS wastewater data and Biobot infection estimates.
While we are showing a range of estimated infections, it is possible that the displayed “Min” values represent an overestimation if the shedding rate is higher for more recent variants or if a significant amount of the signal is due to prolonged shedding. On the other hand, our “Max” values might represent an underestimation, as our adjustment factors are based on known genetic changes that affected detection efficiency until 2022. More mutations in recent years might have led to the need to adjust wastewater values with larger factors, and the extent to which future mutations may further influence these estimates remains uncertain.
Germany
For Germany, we used wastewater data from the Robert Koch Institute’s Abwassersurveillance system [https://github.com/robert-koch-institut/Abwassersurveillance_AMELAG/] (AMELAG, aggregated curve, “loess_vorhersage”) to estimate daily COVID-19 infections. Similar to the U.S. approach, we applied a conversion factor derived from the relationship between wastewater concentrations and infection estimates. This factor was calculated using data from mid- to late-2022, during which we optimized the conversion by maximizing correlations between IHME infection estimates and AMELAG wastewater data.
To account for the impact of SARS-CoV-2 variants, particularly Omicron and post-Omicron mutations [3], we adjusted the wastewater data using two factors derived from solving an optimization problem: 1.23 during the Omicron transition (starting December 17, 2021) and 2.74 for post-Omicron mutations (from August 1, 2022). The conversion factor was calculated by applying these optimized factors to the aggregated, nationwide wastewater data, and then deriving the mean ratio between the two metrics. Newer wastewater data is similarly adjusted before being divided by the conversion factor to produce more recent infection estimates.
Additionally, we calculate and display the 7-day incidence (“7-Tage-Inzidenz”) per 100,000 population alongside daily infection estimates.
Limitations
The initial guesses for the optimization problem (1.53 and 2.28) were based on the maximum expected error regarding the impact of mutations on the underestimation of the wastewater signal [3]. However, in our view, the relatively low second wastewater wave during the period of interest, combined with a likely underestimation of real infections at that time, supported this approach, balancing uncertainties around possible under- and overestimation of recent estimated infections
Sources:
Biobot Analytics SARS-CoV-2 Effective Concentration (SARS-CoV-2 copies / ml sewage)
NWSS Normalized SARS-CoV-2 Concentration (SARS-CoV-2 copies / capita)
References:
[1] Biobot web dashboard – COVID-19 Wastewater Monitoring in the U.S. https://biobot.io/data/covid-19. 2020. Accessed on April 2, 2024
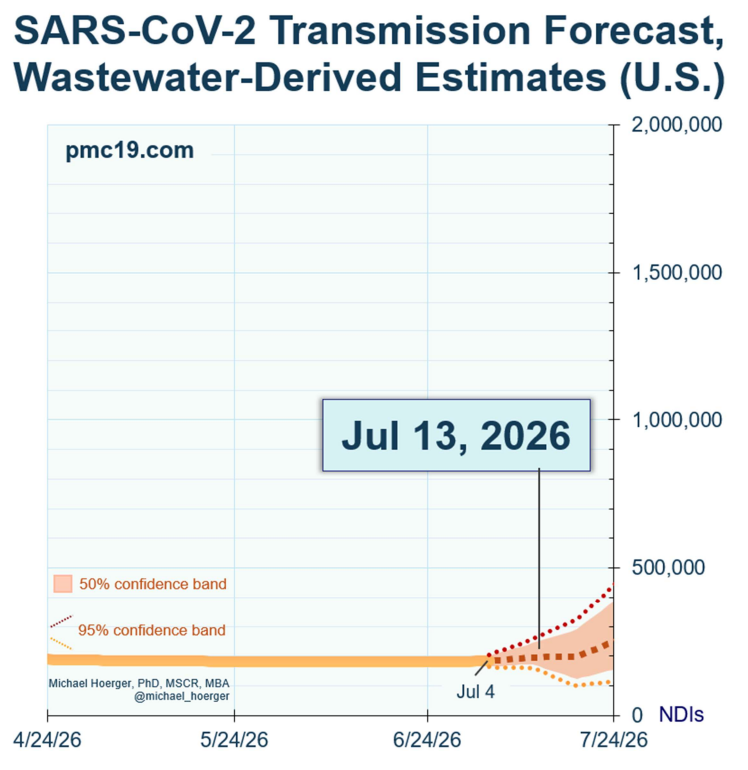
[2] Pandemic Mitigation Collaborative – COVID-19 Forecasting Model. https://www.pmc19.com/data/index.php. 2020. Accessed on April 2, 2024
[3] Underestimation of SARS-CoV-2 in wastewater due to single or double mutations in the N1 qPCR probe binding region. 2024 Preprint. Jianxian Sun, Minqing Ivy Yang, Jiaxi Peng, Ismail Khan, Jhoselyn Jaramillo Lopez, Ronny Chan, Elizabeth Edwards, Hui Peng, https://doi.org/10.1101/2024.02.03.24302274
[4] NWSS Public SARS-CoV-2 Concentration in Wastewater Data. https://data.cdc.gov/Public-Health-Surveillance/NWSS-Public-SARS-CoV-2-Concentration-in-Wastewater/g653-rqe2/about_data. 2022. Accessed on July 31, 2024
PMC Report by Mike Hoerger
Sharing with permission, last updated: 07/13/2026